The main panel in the Data and Parameters tab of the Fitting window allows you to select the data you would like to use for fitting.
The Advanced Options dialog provides access to a dropdown list for ‘data weighting method’ that allows you to choose from three options relating to how each data point is weighted during fitting. All of the options include calculation of a sum of the squares of the difference between the data and the model results, with different data point weightings options for each data series or each data point.
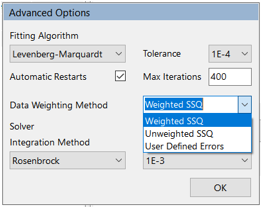
A more detailed discussion of data weighting options is available in this KB article, together with some illustrations of the effects of different weighting choices on parameter fitting results. All data weighting methods are used to calculate a statistic known as ‘maximum likelihood’.
This option takes into account potential bias due to the number of data points in each data series (or column) and the magnitude of the values in each series to calculate a weighted sum of squares with a different weighting on each series. This is the default option (unless experimental errors have been provided in the data sheets within the model, see below) as it is the most generally applicable method, especially useful when the magnitude (e.g. standard deviation) of measurement errors cannot easily be provided as input. This method attempts to give each data series an equal importance (weighting) in the fitting exercise.
This option does not take into account potential bias due to the number of data points in each data series (or column) and the magnitude of the values in each series and simply calculates the total sum of squares (SSQ) of the deviations between the data and model results. When multiple data profiles (e.g. multiple responses) are involved, this method will tend to best fit the profiles with more data points and/or larger values. This is therefore not recommended for fitting exercises (e.g. for fitting both a product and an impurity profile, as the product profile (larger values) will be better fitted than the impurity profile. To correct this, use the default weighted SSQ).
If the standard deviations of the experimental error distributions for each profile (series) are available, these may be entered in the view data window (either relative (%) or absolute (fixed) errors), or in the corresponding data sheets in the Excel version of the model.
With this method, each model residual in the sum of squares is weighted by the corresponding experimental error. With relative errors, that means a different weight for each data point; with fixed errors, that means a different weight for each data series.
When errors are entered in the Excel model, user defined errors is automatically the default selection when the model is opened in the Fitting window.
In Dynochem 5, a new shortcut to apply the same relative or fixed error to all data series in a fit is to enter the error in the first series column of the first datasheet in the Excel copy of the model.
Each parameter fitting method minimizes a ‘Chi-squared' function,2:
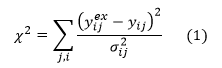
where y is any response that is being fitted, i and j refer to the ith data point in the jth series; superscript ex indicates the experimental measurement and ij the standard deviation of the measurement error distribution for measurement ij.
Weighted sum of squares (WSSQ)
For this default data weighting method, users do not provide experimental error information for use in equation (1). Dynochem back-calculates the standard deviation of the errors for each series that would correspond with a good match between model residuals and experimental error (2=DF=N-p), where DF is the number of degrees of freedom, defined as the number of data points N less the number of fitted parameters, p:
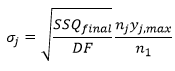
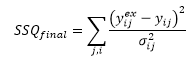
SSQfinal is directly proportional to 2. SSQfinal is reported in this method as SSQ. The standard deviation of the error on the jth series in this method depends on the number of data points in that series relative to those in the first series and the maximum magnitude of the values in the jth series. Larger errors are assigned to series that have more data points and whose values have higher magnitudes; that reduces the emphasis on those series when calculating 2. Smaller errors are assigned to series that have fewer data points and values with lower magnitudes; that increases the emphasis on those series when calculating 2.
New in Dynochem 5, the individual error values assumed for each data point that would correspond with good overlap between measurement errors and model residuals are included in Excel and web reports generated from Fitting, in the new section where each model prediction and measured value are tabulated. We recommend that users review these error estimates as they provide some indication of the likely predictive accuracy of the model.
SSQfinal is calculated from:
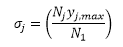
with, for all points in the jth series:
Unweighted sum of squares (SSQ)
For this data weighting method, users do not provide experimental error information. Dynochem back-calculates the standard deviation of the errors for each series that would correspond with a good match between model residuals and experimental error, (2=DF=N-p), where DF is the number of degrees of freedom, defined as the number of data points N less the number of fitted parameters, p:
SSQfinal is directly proportional to 2. SSQfinal is reported in this method as SSQ.
This weighting method gives unequal weight to series with either few or many data and values with either low or high magnitudes and is not recommended for use with multiple responses.
New in Dynochem 5, the individual error values assumed for each data point that would correspond with good overlap between measurement errors and model residuals are included in Excel and web reports generated from Fitting, in the new section where each model prediction and measured value are tabulated. We recommend that users review these error estimates as they provide some indication of the likely predictive accuracy of the model.
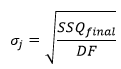
SSQfinal is calculated from:
with ij =1.
User defined errors
For this advanced data weighting method, users must provide experimental error information for use in equation (1). Both relative (%) and absolute (fixed) errors may be assigned to each data series.
It is possible in principle using this method to also backcalculate a scaling factor by which user-defined errors should be increased or reduced in order to obtain good overlap between residuals and measurement errors. See the Appendix of this KB article for more details.