The Experimental Data section is where you input data from your experiments. In an empty model, the experimental section should look like this:
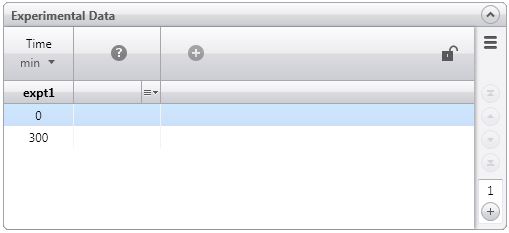
The Experimental Data section is where you input data from your experiments. In an empty model, the experimental section should look like this:
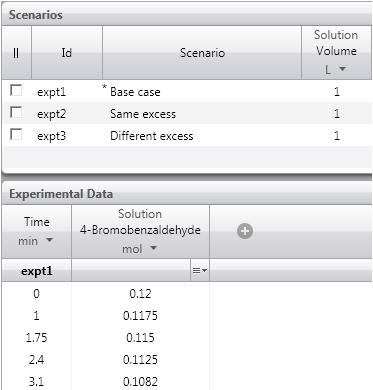
Below is a screenshot of a small section of the Experimental Data panel. A section of the scenarios panel was included to show the expt1 reference in both panels.
You will see that the first column is the Time column (default unit is minutes, however this can be changed to second or hours). To the right of this, is the amount of the starting material, 4-Bromobenzaldehyde, in moles. If you want to add another column header, click on the + icon located to the right of the Solution 4-Bromobenzaldehyde column. More detail about the Experimental Data section is shown below.
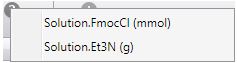
To add a new header, you must click on the  icon to the right of the existing headers. This will bring you to a menu containing all the materials in your model as shown in the example below. Here there are two materials in the model, FmocCl(mmol) and Et3N(g)
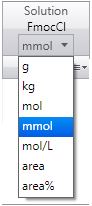
Once you select the material to add a column to the data (in this case FmocCl), you can then select the units in amounts, concentration or areas or area% for materials in the solution phase. If the material is in a solid phase, then the options would be g, kg, mol or mmol. For a material in a gas phase, the options are mol or mmol.
Once you have added your experimental data headers along with the data, you may want to change the order of the columns. There are two options if you want to do this.
If you want to change the order of your headers without changing the order of the data sets, then you must ensure the lock icon at the right end of the column headers is open as shown  . Then click on the experimental data header that you want to move, and drag it to the new position. This will move the data header without moving any of the associated data.
If you want to move both the data header and the associated data, click on  . Now, click on the data header that you want to move, and drag it to the new position. This will move both the data header and the associated data set
The Experimental data menu can be accessed by clicking on the triple bar menu icon  on the right hand side of the panel. It enables you to add a new data set, import data from a text file, copy all the data to the clipboard or add or remove data columns. This is summarized below:
| New data set | Create a new data set. |
| Import data (.csv, .txt)... | Imports data from a csv or text file. |
| Paste as new data set(s) | Paste data from the clipboard as new data set(s). Also adds a new scenario for each data set. |
| Copy all data to clipboard | Copy all data including headers to the clipboard. |
| Export all data... | Export all data as a text file. |
| Add data column | Add a data column to the right. |
| Remove data column(s) | Remove a data column or unassigned/empty columns. |
| Reset all data | Removes all data, leaving two points at 0 and 300 time units. |
| Remove all data | Removes all data, leaving the time point intact. |
| Delete unused data sets | Deletes unused data sets (not referenced in the Id column of any scenario). |
The right-click menu can be used to paste, import, export or remove data for a single data set, described in the table below. Right-click anywhere in the data set you want to change, on a data set header or any data cell:
| Paste | There are 3 options here when pasting: (i) you can replace old data for the new data, (ii) when there is no data present, you can paste the data with a time series, (iii) also when there is no data, you can paste the data that has no time series. |
| Import | The same 3 options apply for importing data as above. |
| Export data set... | Export all data as a text file. |
| Copy | Copies all data from current data set to the clipboard. |
| Insert row | This adds an empty row below the selected row. |
| Delete Selected Rows | Deletes the selected row. This will be grayed out if there is only one row present |
| Reset Data | Removes all data, leaving two points at 0 and 300 time units. |
| Remove Data | Removes all data leaving the time values intact. |
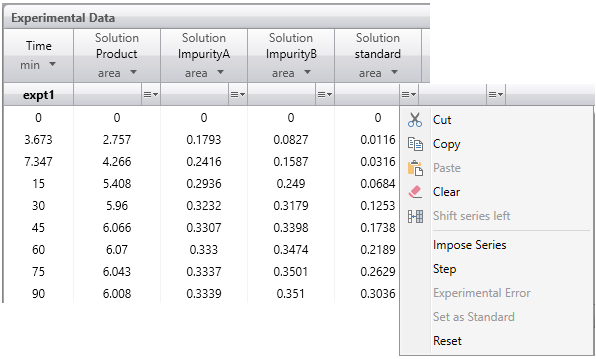
This dropdown menu, accessed from the right end of the data separator row for the series, allows you to cut, copy or paste the data series. See the table below for a full list capabilities.
| Cut | Cuts the data series and puts it onto the clipboard. |
| Copy | Copies the data series onto the clipboard. |
| Paste | Pastes the contents of the clipboard into the selected series. |
| Clear | Clears the series. |
| Shift series left | Shifts the data on the right-hand side into the selected column. Note that this affects the current data set only. |
| Impose Series | Imposes the data set in this series. The impose icon will show when this is selected. |
| Step | Steps the data set in this series. The value stays constant until the next data point, and then jumps to the next value. The step icon will show when this is selected. |
| Experimental Error | Allow you to set an experimental error for this series. You can enter either an absolute value (in the same units as the data) or a %. |
| Set as Standard | Set as the standard component. This is only valid for area models. See below for further details. |
| Reset | Resets the series header to its default state. |
When using HPLC area as the unit for your experimental data, you will have to set one of your components as a standard, so that Reaction Lab can calculate the number of moles represented by each area column.. To do this, click on the droplist arrow as shown in the screenshot below and select Set as Standard for one component. Select a component whose initial area (and moles) are non zero as the standard; the option will be grayed out (like below) if the first area value in the column is zero.
When using area% as the unit for your experimental data, there is no need to define a standard component.
Using either area or area% as the unit will cause the relative response factors of the components to become visible in the Materials section of the model and also to be editable there and/or fitted later in the Fitting window.