What is Sensitivity?
The Sensitivity analysis feature allows you to assess quickly the sensitivity of your plotted responses to your scenario inputs. This may assist in identifying general sensitivities and also which factor settings need to be accurately known for an accurate prediction, or well controlled for a good process result.
New in Dynochem 6, you can also calculate sensitivity with respect to process sheet parameters.
How can I use it?
- You select your Base Case scenario for Sensitivity Analysis
- The scenario inputs are then perturbed, one at a time, by + 0.01% in a series of automatically created simulations
- This small perturbation is designed to obtain accurate gradients of each response with respect to each factor
- The resulting sensitivities are reported in non-dimensional form in a table with color formatting
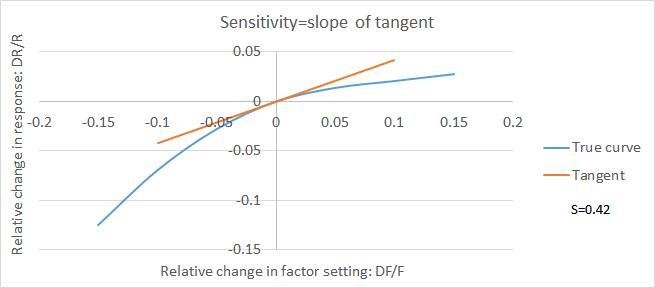
- Nondimensional sensitivity S is the slope of the tangent of dR/R plotted against dF/F, where R is a response and F is a factor (see illustrative plot above)
- The expected relative change in a response DR/R =S x DF/F
- When the absolute value of S, abs(S)>>1, the relative change in a response is much larger than the relative change in the factor and the sensitivity may be considered high
- When the absolute value of S, abs(S)<<1, the relative change in a response is much smaller than the relative change in the factor and the sensitivity may be considered low
- In the above plot, S=0.42, which could be considered a low to moderate sensitivity.
How it works?
You must be in a Dynochem model to use Sensitivity Analysis.
Go to the Dynochem ribbon, and click on the Sensitivity icon  .
.
This will bring you to a Select a Scenario window shown below:
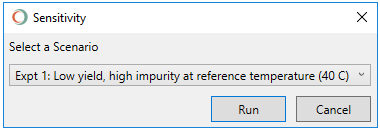
Select the scenario on which to run the analysis by clicking on the dropdown menu, then click Run.
This will run the Sensitivity analysis within a short time, depending on the size of your model.
A new tab called Sensitivity will be added to your model. This will contain the Sensitivity report.
Interpretation of the Dynochem Sensitivity Report
Below is a sample of what you will see after running Sensitivity analysis:
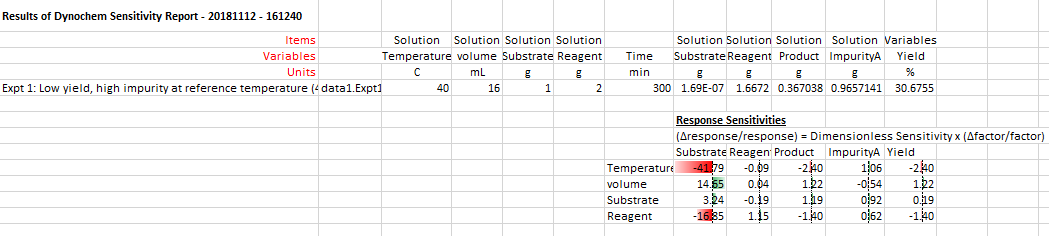
1. The first row contains the Report title along with the date and time when it was generated.
2. The columns to the left contain a copy of the scenario and factor settings.
3. To the right of this are the Reponses. These are the final values (after the simulation) for the base case scenario.
4. Below the Responses are the Response Sensitivities, in non-dimensional form, scaled by the base case factor values and responses.
5. When the sensitivity is negative, also indicated by the red color, increasing the factor by dF/F will reduce the response by dR/R. When the sensitivity is positive, indicated by the green color, increasing the factor by dF/F will increase the response by dR/R.
6. In the above example, the sensitivity for Yield to Temperature is -2.4 (no units) and since this is negative, higher Temperature means lower Yield. As the absolute value of the sensitivity >1, Yield may be considered to be quite sensitive to Temperature.
7. To estimate e.g. the impact of a 1 C increase in temperature on yield, recall that DR/R = S DF/F and therefore DR = 30.6755 x -2.4 x 1/40 = -1.84. (Note that when making this estimate, you are extrapolating the gradient).
8. When the values of responses are close to zero (e.g. Substrate in this case), S may take on large values, as DR/R is high even if DR itself is small. If abs(S) approaches 10000, this indicates that abs(dR/R) is approaching 1.
9. If the sensitivities of a response are not of interest, or distort the sizes of the color bars, you may delete that column of values and this will update the formatting of the remaining columns.
Examples of Sensitivity reports
1. The sensitivity report below comes from the first scenario of the Fed-Batch reaction model in Dynochem Resources:
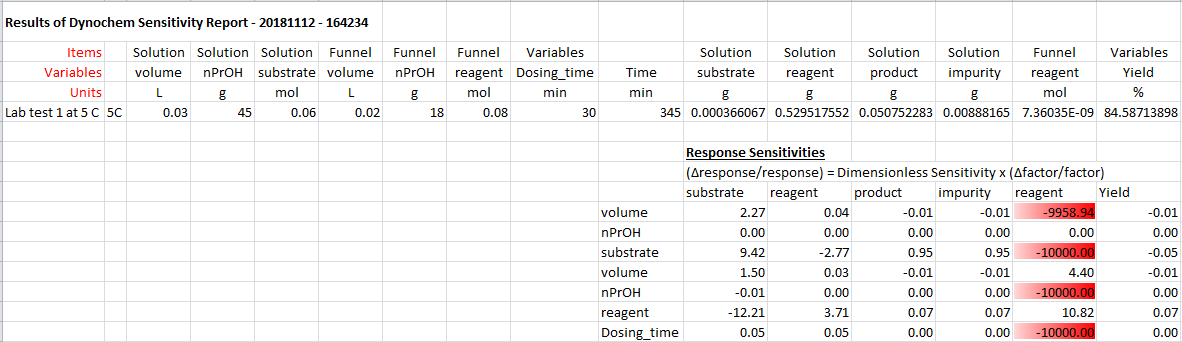
The title of the Sensitivity report is given in the top left-hand corner. The first 9 columns from the left-hand side in this case contain the scenarios title, datasheet name, factors and their values. The next 7 columns after Time in minutes contain the values of the the responses at the end of the Simulation. Below these values, are the Response Sensitivities. You will see the scenario factors listed vertically, and responses listed horizontally. From this table, Yield is quite insensitive to all of the factors listed.
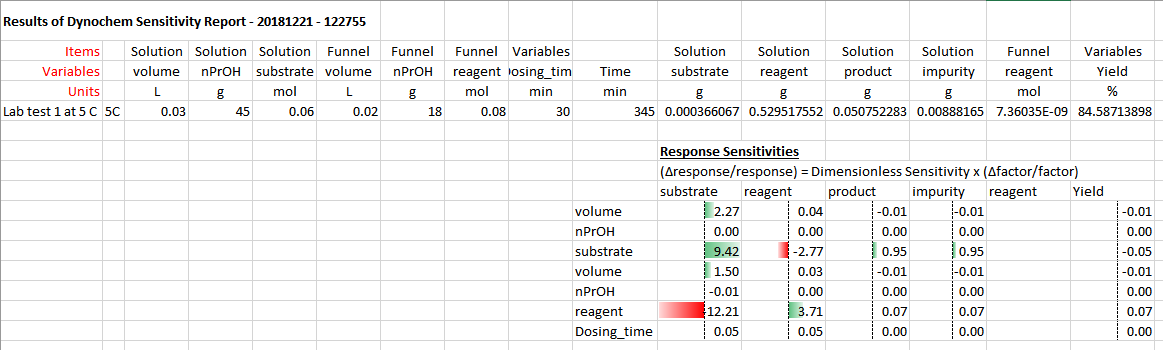
Note that the Funnel reagent column contains some sensitivities whose absolute values are near 1000 and their red shading dominates the color bars; this is because the final response values for funnel.reagent are very small. Deleting these values produces a better visual representation of the other sensitivities.
Both product and impurity have positive sensitivity to substrate and this is why yield has low sensitivity to that factor.
2. The sensitivity report below comes from the first scenario of the homog_consecutive reaction model in Dynochem Resources:
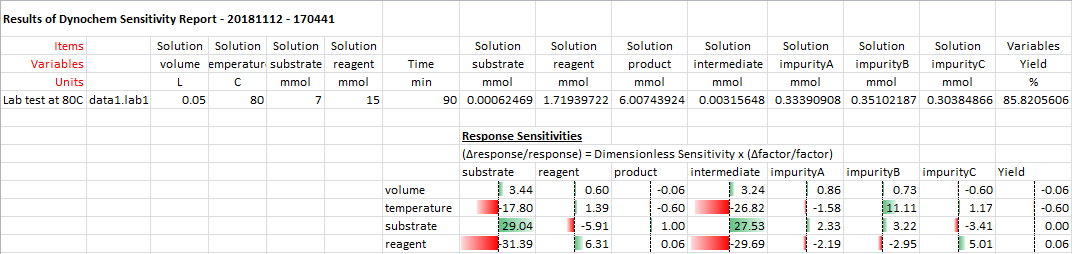
This report indicates some quite high sensitivities of final component amounts to scenario factors but only temperature has a significant impact on yield.