What is Verification?
This feature runs your selected scenarios that contain experimental data and generates a report containing comparisons between model predictions and measured data.
The report, which appears in a new worksheet in Excel includes:
- each measured response value
- each predicted response value
- the residual (or difference) between each measured and predicted value
- summary statistics including a weighted sum of squares calculation, for each response, each scenario and for all responses in all scenarios.
How to run a verification
To run a verification, go to the Dynochem ribbon. You will see Verification in the Run Model section.
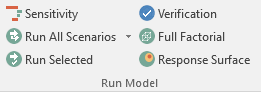
Click on the Verification button. This will open the following window:
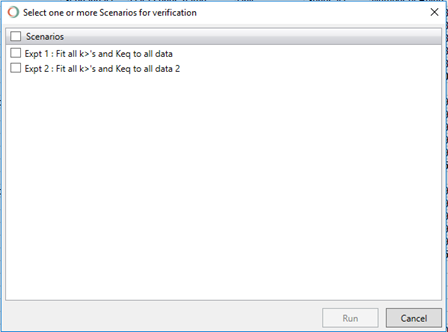
Click on the check box to the left of Scenarios to select to run all scenarios using verification. Alternatively, you can select each scenario individually.
Once the intended scenario(s) are selected, click on the Run button to run verification. Alternatively, click on Cancel to exit out of verification and return to your model.
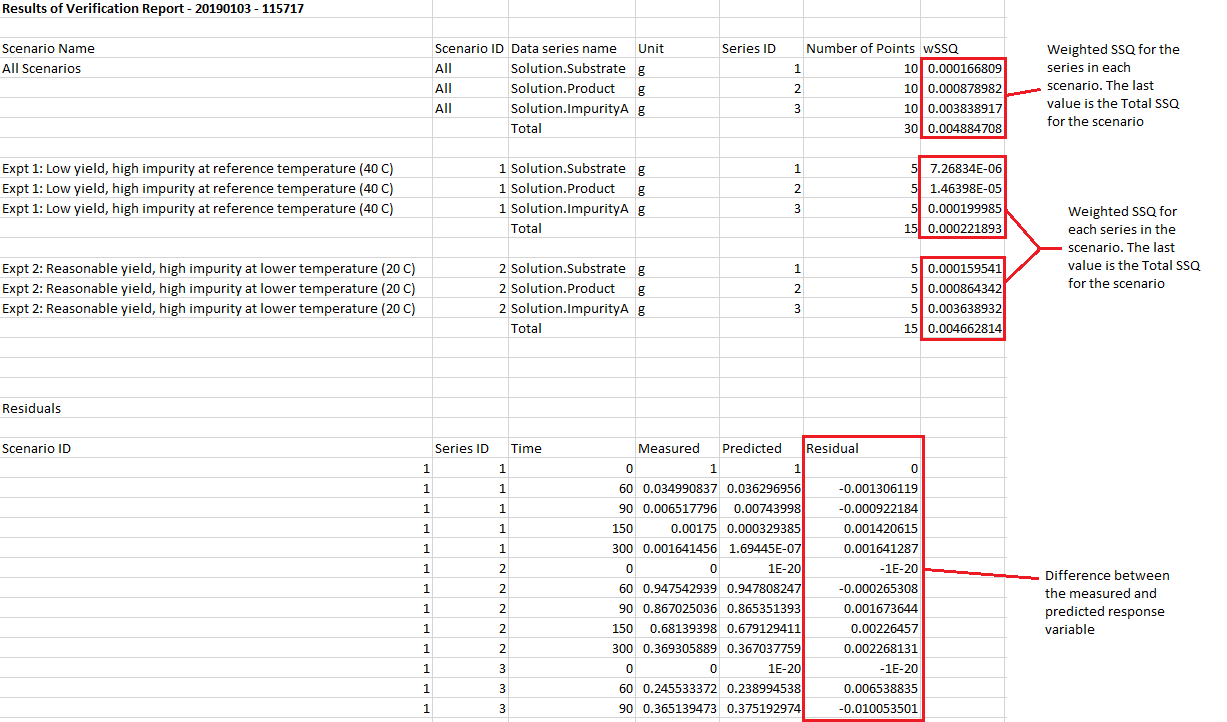
After verification is run, the report will be appear as a new Excel worksheet.
Verification Report
The report contains comparisons between model predictions and measured data and includes the following:
- Each measured response value
- Each predicted response value
- The residual (or difference) between each measured and predicted value
- Summary statistics including a weighted sum of squares calculation, for each response, each scenario and for all responses in all scenarios.
Below is an example of a verification report:
Equations used in the verification report
The residual is calculated according to the following expression:
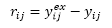
where subscripts i and j refer to the ith data point in the jth series; superscript ex indicates the experimental measurement.
Weighted Sum of Squares (wSSQ) is calculated using:
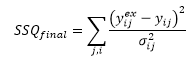
where ij is the standard deviation of the measurement error distribution for measurement ij. For weighted sum of squares:
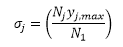
The standard deviation of the experimental error distribution ij on the jth series in this method is estimated from the number of data points in that series relative to those in the first series and the maximum magnitude of the values in the jth series. Larger experimental errors are thereby assigned to series that have more data points and whose values have higher magnitudes; that reduces the emphasis on those series when calculating weighted SSQ. Smaller errors are assigned to series that have fewer data points and values with lower magnitudes; that increases the emphasis on those series when calculating weighted SSQ.