The fitted values and confidence intervals (Conf. Int.) are reported in the table at the top of the Fitting results panel.
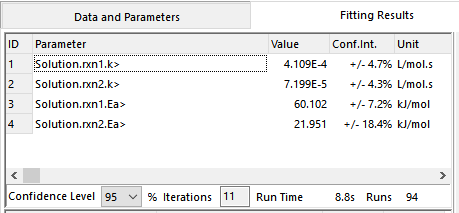
The confidence intervals are expressed as a percentage of the parameter value. In general your aim should be to get the confidence interval smaller than 10-20% of the parameter value. If it is greater than 100%, the fit for that parameter is unreliable (statistically insignificant). In this case it is possible that you should fix the value of the parameter (remove it from the list of parameters to fit) as your data may not contain sufficient information for this parameter to be fitted.
The confidence interval on a parameter value indicates the sensitivity of the model results to changes in the parameter. If the confidence intervals are small, this implies a large sensitivity of the model to the parameter, so there is a ‘sharp’ minimum in the deviation between model and data. If the confidence intervals are large, the effect of changing the parameter on the model is small, suggesting that a broad range of parameter values give similar results.
To emphasize, you should be careful about interpreting your model until you are achieving tight confidence intervals. You cannot for example state that model parameter values have any particular significance or meaning unless these intervals are quite low. Large intervals mean that your data contain little information about those parameters. This can even mean that the corresponding rate processes (e.g. reactions) are not important to include in your model; or that the parameter values should simply be set by you to specific values and not fitted, making your assumptions about those parameters more explicit and evident to you.
New in Scale-up Suite 2, the default option when fitting parameters is Parameter Elimination. This intelligent setting will automatically remove parameters from your fitting list that have high confidence intervals. More details are available in this KB article.
Three confidence levels can be selected from the dropdown: 90%, 95% and 99%, with a default value of 95%. The confidence limit is based on the assumption of a normal distribution for the errors, with 90%, 95% and 99% corresponding to 1.65, 1.96 and 2.58 times the standard error of the parameter fit respectively. The standard errors can be found in the fitting report.
A preview of the fitting report can be obtained by clicking the chi icon  in the Fitting toolbar.