The SSQ (or chi-squared) table shows in the final column the total sum of squares (SSQfinal ) or chi-squared calculated according to the selected data weighting method and the contributions of individual profiles or series to the total:
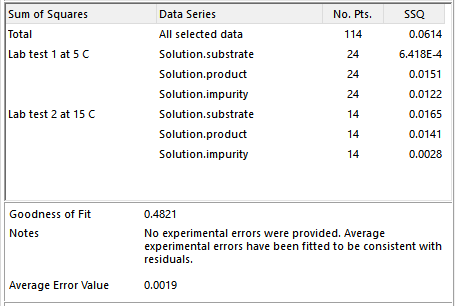
The quoted values are a measure of the lack of fit between the model results and the data. The table shows the contribution of each selected profile to the total lack of fit. A high relative value indicates that the corresponding profile is less well fitted. In addition the number of selected points per profile is reported. Show me more on lack of fit.
The goodness of fit (Q) assessment compares the chi-squared value with a chi-squared distribution. If the value of chi-squared is near the number of degrees of freedom (= [number of data points] – [number of parameters fitted]), the fit is considered good, and a Q of about 0.5 is obtained. The goodness of fit statistic, Q, assumes that the errors are normally distributed.
A good fit in this context means that there is a good level of overlap between model residuals and experimental errors. The Notes reported with Goodness of Fit provide a statement about the model that expands on the Q value (see screenshot above).
When users select the default data weighting method of Weighted SSQ, or the alternative Unweighted SSQ, Dynochem back-calculates the experimental error for each datapoint that would correspond with a 'good fit'. Therefore Q values near 0.5 are always obtained. The corresponding average error value is reported (see screenshot above) and the individual errors are available in the Fitting Report.
When users select the advanced data weighting method of User-Defined Errors, Dynochem uses the errors provided by the user to calculate Q. In this case, a Q value of near 0.5 is not guaranteed:
If Q is very small (Q < 10-3), this indicates that either:
- the model is wrong – it can be statistically rejected
- the measurement errors are in fact much larger than those provided by the user
- the measurement errors are not normally distributed.
If Q moderate (0.001 < Q < 0.95), this indicates a good level of overlap between residuals and experimental errors and a good fit.
If Q is high (0.95 < Q < 1), this indicates that the fit appears to be good, but measurement errors have likely been overestimated.
A good source of additional information on fitting and optimization algorithms and theory is Numerical Recipes in Fortran, 2nd edition, by W.H. Press, S.A. Teukolsky, W.T. Vetterling and B.P. Flannery, Cambridge University Press, 1992.