The Correlation matrix indicates the degree of correlation between pairs of parameters. Values in the correlation matrix vary from -1 (perfectly negatively correlated) to +1 (perfectly positively correlated). A value of 0.0 indicates no correlation between the two parameters. Ideally this matrix should have values close to 0.0 (except on the diagonal), indicating that parameters are uncorrelated (independent of each other), which will tend to also lead to tighter confidence intervals.
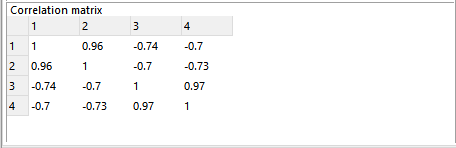
Correlation coefficients near 1 indicate that the two parameters have similar effects on the model, making their contributions difficult to separate. Correlations near -1 indicate they have opposite effects on the model; e.g. changing both may produce no net effect on the solution while changing one produces a major effect.
A high correlation coefficient often indicates that the ratio of the two parameters is important (e.g. forward and backward rate constants for a reversible reaction) as well as the parameter values.
Large correlation coefficients tend to widen the confidence intervals. One approach is to fit a different parameter set (e.g. in with reversible reactions, fit the ratio of forward to backward rate constants (the equilibrium constant) and the forward rate constant). This will probably require a new variable to be set up in the Excel model and a Calculate statement to define the new parameter. This new parameter should then be put on the Scenarios sheet so that it can be selected for fitting.
The correlation matrix is a normalized form of the variance-covariance matrix (or covariance matrix), which is described in the fitting report section. The covariance matrix can be used to estimate joint confidence intervals (confidence ellipses) on multiple parameters.
A preview of the fitting report can be obtained by clicking on the  button in the Fitting toolbar.