The results chart displays the objective function value and the factor values and (y-axes) as a function of iteration number (x-axis). As the iterations proceed the objective function should increase if you are trying to maximize it and should decrease if you are trying to minimize it.
The objective function profile is linked to the left hand side y-axis and the parameter value profiles linked to the right hand side y-axis. Use of either of the axis-rescaling tools will only affect the corresponding y-axis values.
When you are using Set Targets to define the goal, the objective function and the values of each response that is part of the list of targets will appear on the chart and use the left hand side y-axis.
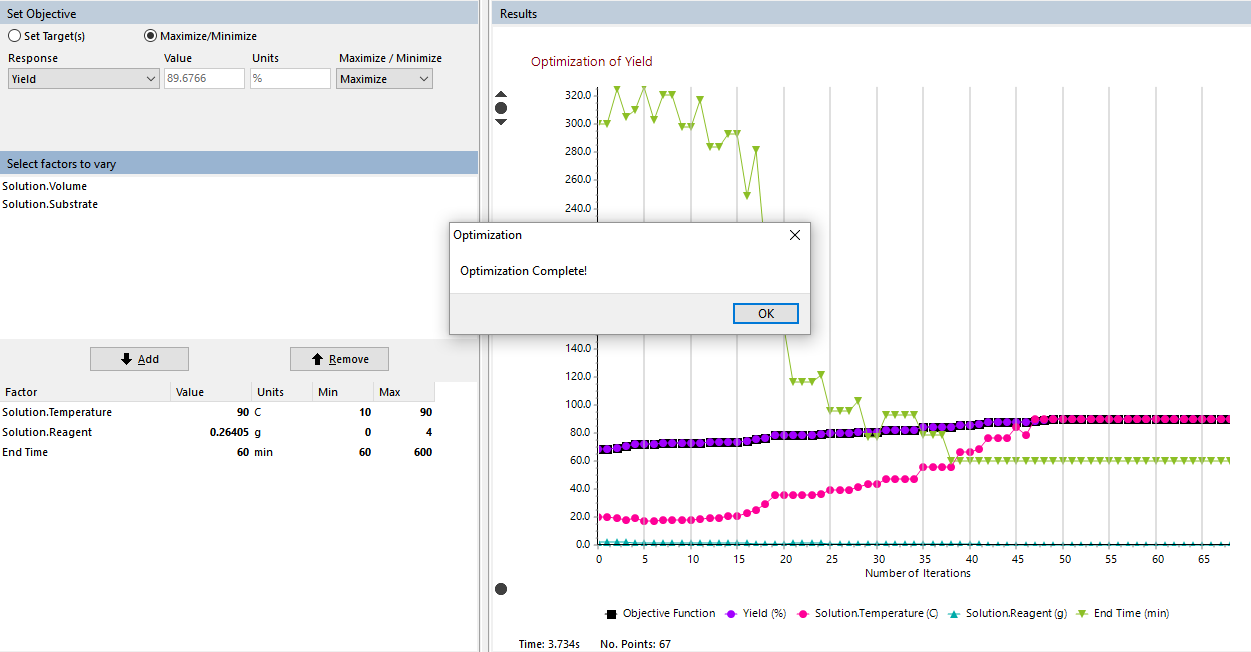
The latest factor values and objective function value are also shown in the Value column under Set Objective and Select parameters to vary panels.
Once an optimum is found both the objective function and the factor values should level off (i.e. not change significantly with iteration). A flat section on the graph is normally due to:
- Automatic restarts. If the automatic restarts do not find a better optimum when checking for a local maximum or minimum, the objective function and parameter values will not be changed. This will appear to the user as if no progress is being made; however useful sensitivity checking is being done. We recommend that automatic restarts are always enabled, but if you want to disable this feature you can do so in the Advanced Options window.
- Factor setting refinement. The objective function could be changing very slightly, so the optimization exercise will not finish, in this case it is likely that the factors are also only changing very slightly. To reduce the number of iterations, reduce the tolerance in the Advanced options (click
 to open) panel.