Ghostlines allow the visualization of two different simulations simultaneously, for example if you run the model in Simulator, change a parameter (e.g. temperature, pressure, amount of starting material) and re-run the Simulation again. You can visualize these two Simulations simultaneously.
Once you are in Simulator, you can switch on Ghostlines by clicking on the button shown below:
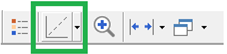
There are two option for Ghostlines where you can toggle options using the button dropdown  .
.
- The Default option is to show the series from the last Simulation
- The second option is to pin the series of the current run.
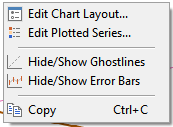
You can create sub plots from the main chart using the toolbar button at the bottom of the main chart:

You can change the series plotted by doube-clicking in the sub plot legend, or clicking the sub plot Edit Series icon.
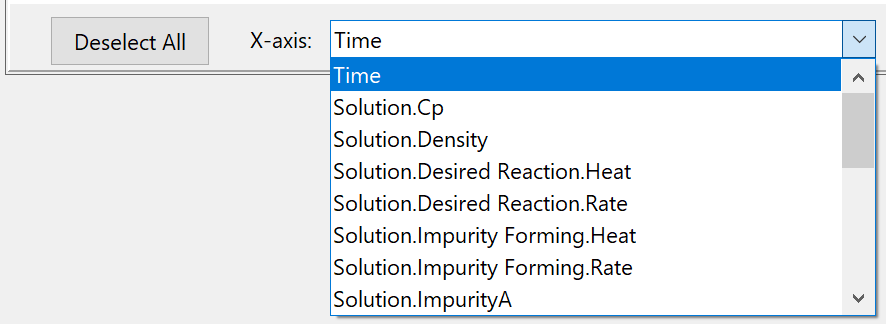
New in Scale-up Suite 2, you can also choose any response to be the x-axis variable on a sub plot, not just time as on the main chart: