Opening the Legend editor (Series window)
To open the Series window and edit what is plotted on the chart do one of the following:
- Double-click in the chart legend
- Right click on the body of the main chart and select Edit Plotted Series… from the dropdown menu.
- Click on the Edit Series icon
 on the Chart Toolbar.
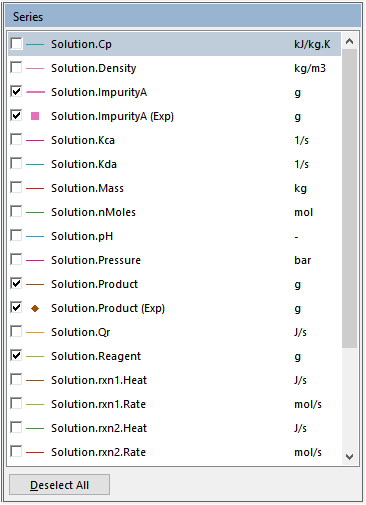
- The series list is in alphabetical order.
- When series name begin with different letters, you can type the first letter of a series name to go directly to that part of the list.
Change the color of series
Double-click on the line or point representing the series. In the Color dialog box select a new color.
Show/hide a series
Click on the checkbox next to the series you want to show or hide.
Deselect all series
Click on the Deselect All button at the bottom of the Series window.
Change the name of a variable
Double click on the variable name and then edit the text in the dialog box that appears.
NOTE: experimental data are shown with the (Exp) extension on the variable name, imposed profiles are shown with the (Imp) extension on the variable name and simulated profiles have no extension.
Change the unit of a variable
Double-click on the unit and edit the dialog box that appears.
These units changes propagate throughout the current scenario to every window in which the selected variable appears.
Change the legend font
- Right click on the body of the main chart and select Edit Chart Layout… from the dropdown menu.
- On the Chart Layout tab and click on the Legend Font button.
- In the Font dialog box select a new font, type and size.
- Click OK.