Opening the Chart Layout window
Do one of the following:
- Right click on the body of the main chart and select Edit Chart Layout... from the dropdown menu.
- Click on
 in the chart toolbar and select the Chat Layout tab.
- If text boxes in this window are not editable using your mouse, use the tab key to cycle through the controls until the correct one is selected.
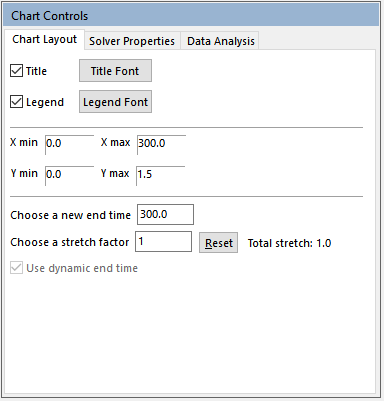
Change the Chart legend display
- To hide/show the chart legend click on the checkbox next to Legend.
- To change the font of the legend click on the Legend Font button. In the Font dialog box select a new font, type, size or color.
- To change what is plotted on the chart double-click on the legend and use the Series window.
Changing the display of the Chart axes
-
- To change the linear scale of each axis, type the new minimum (X Min or Y Min) and maximum values (X Max or Y Max) you want to see displayed on the chart. You can also use the Axes controls to rescale the chart.
- To make the y-axis maximum value adjust automatically to the series values plotted, check the box beside Automatic Rescale.
Change the end time of a simulation
Edit the value in the cell labeled ‘Choose a new end time’ and press <return>.
Note: A quick way to extend run time is to click on the down arrow next to the continue button  in the run controls and select from the list (10%, 25%, 50%, 75%, 100%).
Change the stretch factor on imposed profiles
Edit the value in the cell labeled ‘Choose a stretch factor’ and re-run the model.
Note: A quick way to change the stretch factor is to click on the down arrow next to the stretch icon  in and select from the list (0.5, 0.75, 0.9, 1.1, 1.33, 2 or other).
A typical application is to stretch an imposed flowrate and/or Qr profile for dosing-controlled reactions. This function allows you to easily change (stretch or squeeze) addition rate and/or rate of heat release whilst maintaining the overall volume added or total heat released.