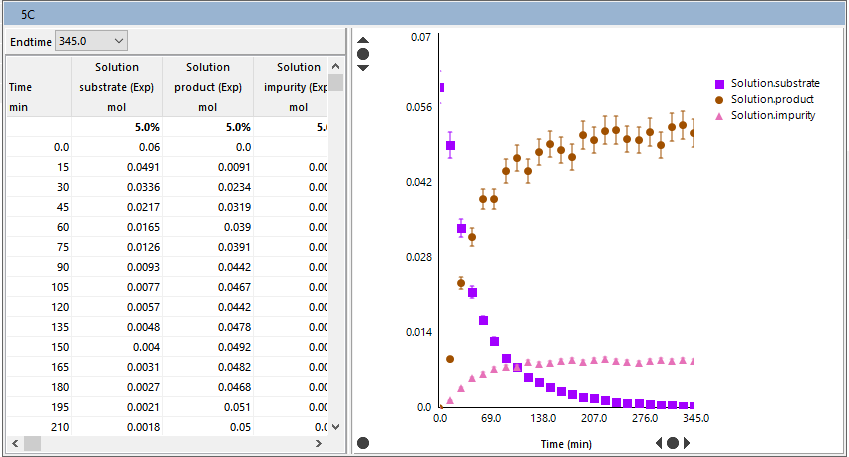
This window shows the selected data profiles in a scenario and gives additional control over the individual data points to be used in a fitting exercise. You can deselect either individual points, columns of data or rows of data after a certain time value. The data are given in the table on the left and plotted in the chart on the right.
To deselect a point, right click on the value in the table and then click on Select/Deselect. This will grey out the cell in the table, and also the corresponding point in the chart. To reselect this point, right click on the grayed out cell.
To deselect a column, use the checkboxes for the data series in the Data and Parameters window before clicking View Data. Reselecting the column can also be done in the same way.
To deselect rows, do one of the following:
- Right click in the Time column and click on Deselect row (to deselect an individual row) or
- Use the Endtime dropdown menu (at the top of the window) to deselect all rows after the specified end time.
Tip
This is useful if you want to fit to the initial part of a run where, e.g. species concentrations change most quickly.
You can also set user-defined errors in this window, if you have selected User Defined Errors as your data weighting method.
When finished in this window, right-click in the title bar to close.