Do one of the following:
- Right click on a curve in the main chart and select Edit Data Analysis... from the dropdown menu.
- From the Simulator menu, use Edit>Data Analysis
- Click on the Edit Solver icon
 in the chart toolbar and then click on the Data Analysis tab.
The totalizer function can be directly used by right clicking on an appropriate series in the
chart.
Each of the data analysis functions are useful when comparing series predictions with measured values and can be applied to series with both experimental and simulated data:
- Residual
- SSQ
- Variance
- Chi-squared
- Standard deviation
Totalizer is useful to totalize rates, so can only be applied to plotted variables with a rate type unit (e.g. mol/s, J/s, W, L/min etc).
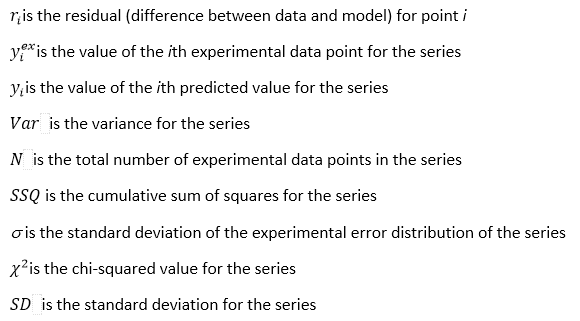
Nomenclature used in the equations
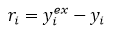
Residual
The residual is the difference between data and model:
One residual is plotted for each data point. If the fit is good, the residuals should be scattered around the x-axis. If there is a clear systematic trend in the residuals, it indicates that the model does not describe the data well.
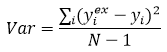
Variance
The variance is the cumulative sum of squares divided by the number of data points - 1. This is one indicator of goodness of fit:
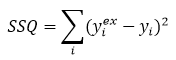
Sum of Squares
This is the cumulative sum of squares (squares of the residuals):
Show me more on SSQ usage in parameter fitting.
Chi squared
The chi-squared statistic is the sum of squares weighted with user defined errors. If no errors are supplied for the data series (in the data sheet) or the error is 0, then s is set to 1:
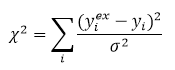
Show me more on CHISQ usage in parameter fitting.
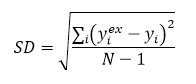
Standard deviation
The standard deviation is the square root of the variance. It has the same units as the data series being analyzed:
Totalizer
Integrates a plotted rate curve using the trapezoidal rule, e.g. producing cumulative moles from a plot in mol/s.