Basics
- The Main chart appears by default on opening a new Scenario in Simulator and is rarely closed when using DynoChem.
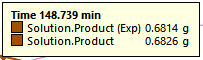
- The values and units of simulated and experimental data are displayed by left-clicking of a series.
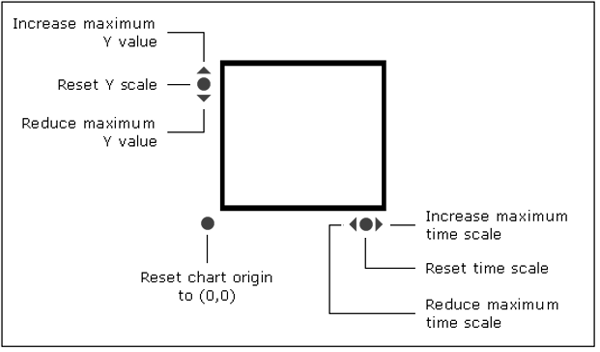
- The simulator axes controls help you to quickly reformat your plot:
- To start a simulation click on the Run button
 in the Run controls at the bottom of the chart.
- Should the Main chart close, you can re-open it by clicking on the Chart icon in the View toolbar.
Formatting the Chart
Editing the series plotted
To edit which series are plotted on the chart, double-click in the chart legend and the Series window will open. Use the checkboxes to select/deselect variables to be plotted on the chart. Show me more on the Series window.
Editing the chart layout
The formatting and appearance of the chart can be set in the Chart Layout interface.
Chart Functions
Series function
- Right click on an experimental data point or on a simulated curve.
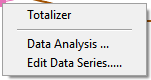
- The options available are:
- Totalizer - uses the trapezoidal rule to integrate a plotted series that is a rate (unit/time).
- Data analysis - opens a window for calculating statistics on your experimental and simulated data. The available functions are: residual, variance, sum of squares, chi squared standard deviation and Totalizer.
- Edit data series - this opens the Series window in which you can select/deselect which data and variables to plot on the chart.
Click and drag imposed profiles
The profile of imposed data in a model can be directly adjusted in the chart. With the mouse, hover over a point you want to move and the ‘hand’ icon will appear. With the ‘hand’ icon visible, click and drag the point to its new value. Points can only be dragged vertically to ensure that the time value of the point is not lost.
To add a new point to a profile, position the cursor and ctrl+left click.
To delete a point from a profile, position the cursor on the point and shift+left click.
Tip: set up your imposed profiles in the model data sheets in Excel with several ‘extra’ points along the profile so that you can easily try new profiles without having to add new points in Simulator.
Exporting the Chart
Print, copy or Export the Chart
Do one of the following:
- Right-click on the chart and select Copy from the dropdown menu.
- With the chart in focus, click on Edit... Copy.